


Advancements in Dissolved Gas Analysis: Data Quality
By Dr. Zachary H Draper & Dr. James J Dukarm
Download Our OSHA 3873 Fact Sheet – Minimum Approach Distance and Training Requirements
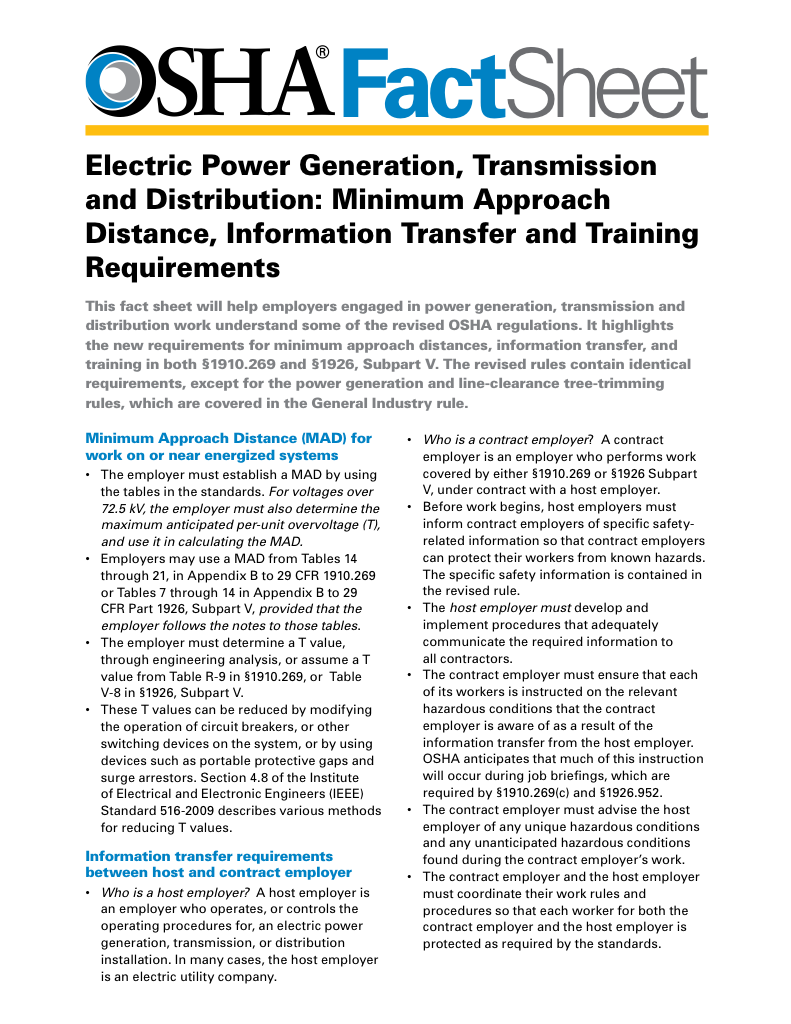
- Calculate MAD using voltage and overvoltage values
- Ensure proper communication between host and contract employers
- Meet OSHA training requirements for qualified electrical workers
Advancements in DGA data quality enable precise transformer monitoring, dissolved gas analysis, and predictive maintenance through calibrated sensors, IEC 60599/IEEE C57.104 harmonization, machine-learning analytics, anomaly detection, and IEC 61850-integrated SCADA data integrity.
What Are Advancements in DGA Data Quality?
Enhanced DGA data quality strengthens transformer diagnostics via calibrated sensors, aligned standards, and analytics.
✅ On-line oil monitors with auto-calibration and drift correction
✅ IEC 60599/IEEE C57.104 harmonized thresholds and diagnostics
✅ ML-based anomaly detection and condition-based maintenance
Introduction
There is more to DGA interpretation than comparing the latest gas concentrations to limits in a table or plotting them in a triangle or pentagon to identify the apparent fault type. We have found that the whole DGA history of a transformer must be considered when interpreting its most recent DGA results.
Trend evaluation and accurate assessment of short-term changes require accuracy and low measurement variability of gas data. Data quality problems must be recognized and dealt with before an interpretation is attempted. Below we point out some of the most common data quality issues. For broader context on diagnostics, the primer on dissolved gas analysis outlines core fault signatures, typical gas sources, and interpretation pitfalls.
Understanding how oil and paper behave electrically is foundational, and the summary of fundamental dielectric characteristics helps explain why certain gases trend together over time.
Data management
As a result of the historical importance of DGA data, proper organization and preservation of DGA data are extremely important. In addition to archiving the lab reports, keep the data in tabular form in a database or, for small volumes of data, a spreadsheet. A well-organized database supports sorting and filtering for graphical and statistical analysis.
Use a unique and permanent ID to identify transformers, oil compartments, and the oil sample data belonging to them. Substation and unit number are not a suitable ID, for the same reason that the dentist doesn’t identify you by your department and job title. Large transformer fleets may require company-assigned asset numbers to avoid possible serial number duplication across manufacturers.
Disciplined chain-of-custody practices provide correct IDs of transformers and compartments to be sampled, ensure that oil samples are labeled correctly, and guarantee that analysis results returned by the lab are attributed to the right transformers and oil compartments. Integrating laboratory reports with a structured repository is easier when guided by practical notes on transformer oil analysis data formats and decision thresholds.
Sign Up for Electricity Forum’s Dielectric Fluids Newsletter
Stay informed with our FREE Dielectric Fluids Newsletter — get the latest news, breakthrough technologies, and expert insights, delivered straight to your inbox.
For sampling logistics and labeling discipline, operations teams can review guidance on oil in transformers to align maintenance practices with data management goals.
Data inconsistency or inaccuracy
Gas loss that is deliberate, such as by head space pressure regulation or use of a desiccant breather, needs to be accounted for as discussed in our other article [1]. Unintended gas leakage from a transformer – often detectable by a O2/N2 ratio persistently above 0.2 when it should be lower – should be remedied as soon as possible, both to keep DGA effective and to prevent moisture ingress. After oil degassing, it is advisable to exclude samples from DGA interpretation for 6-12 months due to the false upward trends created by diffusion of gases from winding paper into the bulk oil.
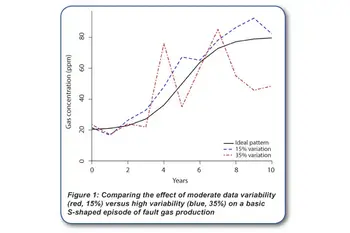
Accuracy and repeatability of gas data are only partly up to the laboratory. Unrepresentative oil samples can lead to inconsistent and highly variable gas data regardless of the quality of laboratory measurements. A study by a large USA electric utility [2] shows that using extra care and a moisture / temperature probe to ensure collection of representative oil sample can reduce data variability considerably. The figure (Figure 1) illustrates the effect of moderate variability (±15%) versus high variability (±35%) on the data from a basic S-shaped gassing event.
Moderate variability is experienced with consistently good sampling practice and a good laboratory. High variability is easily attainable if there is a problem with sampling practices. Recent field case studies on advancements in dissolved gas analysis discuss accounting for gas loss, diffusion effects, and sampling bias.
When evaluating short-term changes following maintenance, further techniques described in advancements in DGA interpretation can reduce false alarms by emphasizing trend shape over single-point limits.

The table provides a summary of some common data quality problems. Sections 5.1 and 5.2 of IEEE C57.104-2019 [3] contain a detailed discussion of data quality assessment. For paper-aging diagnostics specifically, insights on the CO/CO2 ratio in DGA clarify when cellulose decomposition is the likely source.
References
[1] “Advancements in Dissolved Gas Analysis: Accounting for Gas Loss,” Electricity Today, March 2020
[2] T. Rhodes, “Using field moisture probes to ensure drawing a representative oil sample,” in 82nd Annual International Doble Client Conference, Doble Engineering Company, March 2015.
[3] “IEEE Guide for the interpretation of gases dissolved in mineral oil filled transformers”, IEEE Std C57.104-2019.