


Advancements in Dissolved Gas Analysis Explained
By Dr. Zachary H Draper & Dr. James J Dukarm
Download Our OSHA FS3529 Fact Sheet – Lockout/Tagout Safety Procedures
- Learn how to disable machines and isolate energy sources safely
- Follow OSHA guidelines for developing energy control programs
- Protect workers with proper lockout devices and annual inspections
Advancements in dissolved gas analysis2 deliver smarter transformer condition monitoring, predictive maintenance, and fault diagnostics via online sensors, IEC 60599 methods, Duval Triangle analytics, and machine learning for grid reliability.
What Are Advancements in Dissolved Gas Analysis2?
Modern DGA methods using online sensors, IEC standards, and AI to diagnose transformer faults proactively.
✅ Real-time gas monitoring via online chromatographs and sensors
✅ AI and Duval Triangle enhance fault classification accuracy
✅ Standards-based analysis per IEC 60599 supports maintenance
One of the most important steps when looking at DGA data is to decide whether the data support the existence of a fault that is actively breaking down the insulation before you try to use a triangle, pentagon, or gas ratio method to identify a fault type. Otherwise, you are diagnosing random measurement noise, not the transformer. Conventional methods assign limits to each of the gases to detect and assess abnormal gas formation. Formerly it was common practice to add gas concentrations together to get total dissolved combustible gas (TDCG). The hope was to simplify the task of detecting abnormal gas production and interpreting rates of change. This, however, was equivalent to counting U.S. Dollars, Mexican Pesos, Bitcoins, and Canadian Loonies and thinking that the sum represented “value”. To reduce false positives from sensor drift and sampling errors, recent work on advancements in DGA data quality outlines practical controls for sampling, calibration, and trending.
Electrical Transformer Maintenance Training
Substation Maintenance Training
Request a Free Training Quotation
Chemistry dictates that each gas we observe requires a different amount of energy to break away from the original insulating material. Instead of trying to interpret several individual gas concentrations, why not follow the energy associated with the gassing? The energies required to form the gas can be weighted by the gas concentrations and added up.
Sign Up for Electricity Forum’s Dielectric Fluids Newsletter
Stay informed with our FREE Dielectric Fluids Newsletter — get the latest news, breakthrough technologies, and expert insights, delivered straight to your inbox.
For a grounding in principles and typical fault signatures, see this overview of dissolved gas analysis techniques and their diagnostic use.
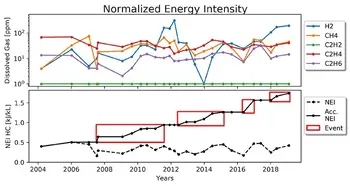
This idea of using standard heats of formation of fault gases for DGA was worked out in Jakob et al. 2012 and demonstrated to be an improvement compared to TDCG and other gas concentration sums. Soon after that, chemist Fredi Jakob realized that it would be better to create a fault energy index, which he called normalized energy intensity (NEI), to represent the influence of an internal fault on the insulating oil. That idea was presented in Jakob & Dukarm 2015, where it was shown that NEI was very useful for trending fault severity and not partial to any particular fault types. The figure illustrates how trending cumulative NEI simpli.es the detection of suspicious gas production. For additional context on modern interpretation frameworks, review these advancements in dissolved gas analysis that compare energy-based indices with classical ratio methods.
NEI, now renamed NEI-HC, is based on the low molecular weight hydrocarbon gases generated from cracking mineral oil. Another fault energy index, called NEI-CO, is based on the carbon oxide gases formed by pyrolysis of cellulose in paper insulation. The formulas for NEI-HC and NEI-CO are shown in Equations (1) and (2) below. Since each set of gases comes from a different insulation material, you can assess and track which faults are affecting paper, hot metal in the oil, or both. That knowledge can help point to the root cause and better estimate the severity of the problem. When paper degradation is suspected, trends can be corroborated with guidance on the CO/CO2 ratio in DGA to strengthen evidence for thermal versus oxidative effects.


Because NEI-HC derives from oil cracking, selecting and maintaining a high-quality transformer insulating oil is essential for resilient performance under thermal stress.
NEI-HC = 77.7[CH4] + 93.5[C2H6] + 104.1[C2H4] + 278.3[C2H2] / 22400 (1)
NEI-CO = 101.4[CO] + 30.19[CO2] / 22400 (2)
The highest heat of formation for the hydrocarbons is C2H2 and for carbon oxides it is CO. This physically confirms the general intuition that these gases are the most concerning to see in transformer DGA. These concerns underscore why routine transformer oil analysis remains central to risk-based maintenance planning.
You can trend fault energy indices to identify gassing episodes and relate them to external events such as through faults, maintenance work orders, and load changes to help determine what might have triggered the gassing. Also, you can track the cumulative energy over the history of the transformer to counteract effects of gas-loss (see previous article in this series). Interpreting those trends alongside the unit's fundamental dielectric characteristics helps differentiate benign load-related gassing from insulation distress.